- AI
- Application
- Base64Helper
- Browser
- Clipboard
- Converter
- Credentials
- Database
- Excel
- File
- Form
- Gherkin
- GoogleDrive
- GoogleSheets
- Grid
- ImageHelper
- Launcher
- Logger
- PuppeteerClient
- Request
- RESTClient
- Selector
- Url
- Cryptography
- YouTube
Form
- Form Layout and Controls
- Showing and Hiding Forms
- Filling Forms with Data
- AI Input and Output Controls
- Settings Every Control Takes
- GPALButton
- GPALCheckBox
- GPALRadioButton
- GPALInput
- GPALTextArea
- GPALLabel
- GPALComboBox
- GPALListView
- GPALDataGridView
- GPALChart
- GPALDateTimePicker
- GPALNumericUpDown
- GPALFileSelector
- GPALTab
- GPALMenuBar, GPALToolbar and GPALBarItem
- GPALTreeView
- GPALPicture
- GPALProgressBar
- GPALStatusStrip
- GPALGroupBox
- GPALSplitter
- GPALSlider
- GPALRichTextBox
- GPALTableLayoutPanel
Form
GPALChart
Everything on Settings Every Control Takes applies here too. GPAL.Chart builds one. WithTitle sets the title drawn above it, WithPalette the color palette it draws with, and WithSeries adds a data series. Click and DoubleClick are wired the usual way, and a chart also answers the drag events, DragDrop, DragEnter, DragLeave and DragOver. GPAL.ChartFor(title) is the shorthand.
Examples
//The Series is a Windows Forms chart series, so anything that library can draw is available; GPAL hands it through rather than wrapping it.
GPALChart throughput = (GPALChart)GPAL
Series series = new Series("Pages") { ChartType = SeriesChartType
series
series
throughput
Documentation Example
Documentation
Showing off some plain text in these paragraphs eligendi laboriosam illo nostrum corporis at libero vel voluptas? Expedita, facere dolores voluptatem ad ab rem assumenda soluta!
Lorem ipsum dolor sit amet consectetur adipisicing elit. Obcaecati, iste distinctio veritatis eligendi laboriosam illo nostrum corporis at libero vel voluptas? Expedita, facere dolores voluptatem ad ab rem assumenda soluta!
Lorem ipsum dolor sit amet consectetur adipisicing elit. Obcaecati, iste distinctio veritatis eligendi laboriosam illo nostrum corporis at libero vel voluptas? Expedita, facere dolores voluptatem ad ab rem assumenda soluta!
Category
-
Endpoint
Lorem ipsum dolor sit amet consectetur adipisicing elit. Quo veniam mollitia excepturi animi eum illum non libero sapiente provident assumenda, delectus voluptatum nobis sed dolorem adipisci laudantium incidunt. Error, ratione?
-
Enpoint
Lorem ipsum dolor sit amet consectetur adipisicing elit. Quo veniam mollitia excepturi animi eum illum non libero sapiente provident assumenda, delectus voluptatum nobis sed dolorem adipisci laudantium incidunt. Error, ratione?
-
Enpoint
Lorem ipsum dolor sit amet consectetur adipisicing elit. Quo veniam mollitia excepturi animi eum illum non libero sapiente provident assumenda, delectus voluptatum nobis sed dolorem adipisci laudantium incidunt. Error, ratione?
-
Enpoint
Lorem ipsum dolor sit amet consectetur adipisicing elit. Quo veniam mollitia excepturi animi eum illum non libero sapiente provident assumenda, delectus voluptatum nobis sed dolorem adipisci laudantium incidunt. Error, ratione?
Other formats
Here you can find different accents and emphasis sit amet consectetur adipisicing elit. Obcaecati, iste distinctio veritatis eligendi laboriosam illo nostrum corporis at libero vel voluptas? Expedita, facere dolores voluptatem ad ab rem assumenda soluta!
This is a link and how it could look like bestlinkinthebeautifulworld. Obcaecati, iste distinctio veritatis eligendi laboriosam illo nostrum corporis at libero vel voluptas? Expedita, facere dolores voluptatem ad ab rem assumenda soluta!
Here's just some classic bold text adipisicing elit. Obcaecati, iste distinctio veritatis eligendi laboriosam notBoldSecondbestlinkinthebeautifulworld illo nostrum corporis at libero vel voluptas? Expedita, facere dolores voluptatem ad ab rem assumenda soluta!
Obcaecati, iste distinctio veritatis eligendi laboriosam adipisicing elit illo nostrum corporis at adipisicing elit libero vel voluptas? Expedita, adipisicing facere dolores voluptatem ad ab rem assumenda soluta!
Other cuple of colors in case we want to emphasize several ways adipisicing elit. Obcaecati, iste distinctio veritatis eligendi laboriosam adipisicing elit illo nostrum corporis at voluptatem libero vel voluptas? Expedita, facere dolores voluptatem ad ab rem assumenda soluta!
Adding Images to the content
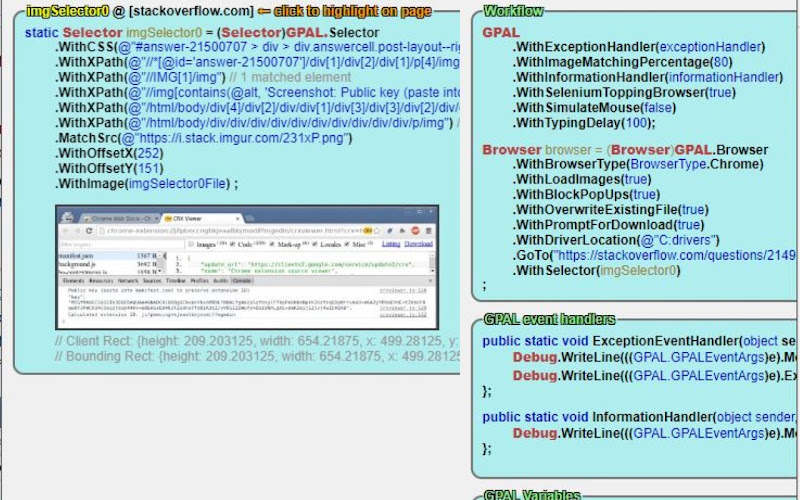
Lorem ipsum dolor sit amet consectetur adipisicing elit. Obcaecati, iste distinctio veritatis eligendi laboriosam illo nostrum corporis at libero vel voluptas? Expedita, facere dolores voluptatem ad ab rem assumenda soluta!
Lorem ipsum dolor, sit amet consectetur adipisicing elit. Quod veniam, quam ad expedita laborum sed at voluptates culpa ipsam ut vel. Ullam temporibus a mollitia quod aliquam ratione exercitationem nesciunt.
Lorem ipsum dolor sit amet consectetur adipisicing elit. Obcaecati, iste distinctio veritatis eligendi laboriosam illo nostrum corporis at libero vel voluptas? Expedita, facere dolores voluptatem ad ab rem assumenda soluta!
Lorem ipsum dolor, sit amet consectetur adipisicing elit. Quod veniam, quam ad expedita laborum sed at voluptates culpa ipsam ut vel. Ullam temporibus a mollitia quod aliquam ratione exercitationem nesciunt.
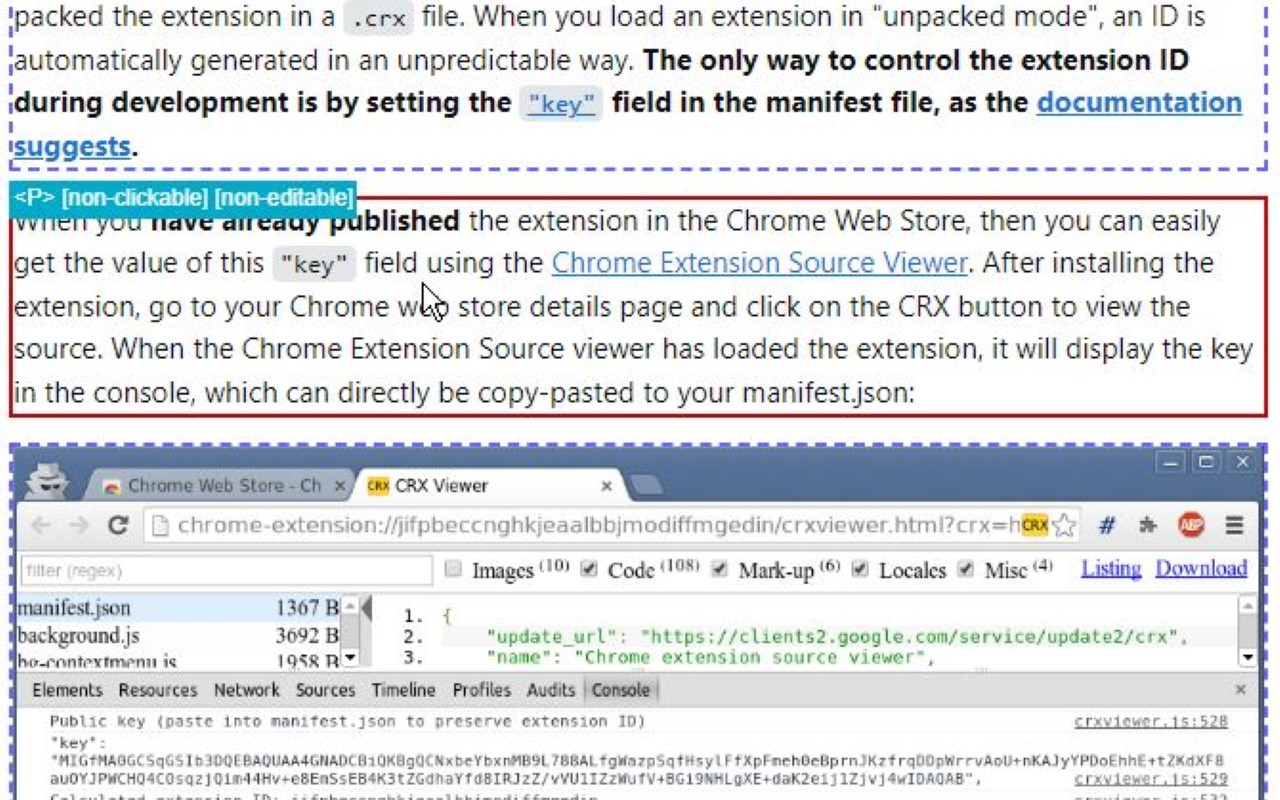
Lorem ipsum dolor sit amet consectetur adipisicing elit. Obcaecati, iste distinctio veritatis eligendi laboriosam illo nostrum corporis at libero vel voluptas? Expedita, facere dolores voluptatem ad ab rem assumenda soluta!
Coding Blocks
Lorem ipsum dolor sit amet consectetur adipisicing elit. Repudiandae quas consequuntur illo numquam assumenda autem exercitationem distinctio perspiciatis in natus. Eius dicta similique ipsam ipsa minima, nemo quae enim tempore.
GPAL
.CallIfNotFound(GenericCallIfNotFound)
.WithPublishToConsole();
//System.Drawing.Rectangle windowSize = new System.Drawing.Rectangle(10, 10, 1500, 1024);
// NOTE: we have to set browser = before we execute any steps
// this is due to the 'GenericCallIfNotFound' which might throw an exception, and BankScraper will not have the browser set when it calls scraper.Close()
// until the complete fluent line gets executed (meaning every step, meaning browser is not set until everything else succeeds)
browser = GPAL.Browser
.WithBrowserType(Enums.BrowserType.Chrome)
.WithProfileDataDirectory(ChromeProfileLocation)
.WithUseAutomationEngine(AutomationEngine.Selenium)
.WithWindowSize(new System.Drawing.Rectangle(0,0,1920,1080))
.ToGPALObject();
Documentation
Showing off some plain text in these paragraphs eligendi laboriosam illo nostrum corporis at libero vel voluptas? Expedita, facere dolores voluptatem ad ab rem assumenda soluta!
Lorem ipsum dolor sit amet consectetur adipisicing elit. Obcaecati, iste distinctio veritatis eligendi laboriosam illo nostrum corporis at libero vel voluptas? Expedita, facere dolores voluptatem ad ab rem assumenda soluta!
Lorem ipsum dolor sit amet consectetur adipisicing elit. Obcaecati, iste distinctio veritatis eligendi laboriosam illo nostrum corporis at libero vel voluptas? Expedita, facere dolores voluptatem ad ab rem assumenda soluta!
Category
-
Endpoint
Lorem ipsum dolor sit amet consectetur adipisicing elit. Quo veniam mollitia excepturi animi eum illum non libero sapiente provident assumenda, delectus voluptatum nobis sed dolorem adipisci laudantium incidunt. Error, ratione?
-
Enpoint
Lorem ipsum dolor sit amet consectetur adipisicing elit. Quo veniam mollitia excepturi animi eum illum non libero sapiente provident assumenda, delectus voluptatum nobis sed dolorem adipisci laudantium incidunt. Error, ratione?
-
Enpoint
Lorem ipsum dolor sit amet consectetur adipisicing elit. Quo veniam mollitia excepturi animi eum illum non libero sapiente provident assumenda, delectus voluptatum nobis sed dolorem adipisci laudantium incidunt. Error, ratione?
-
Enpoint
Lorem ipsum dolor sit amet consectetur adipisicing elit. Quo veniam mollitia excepturi animi eum illum non libero sapiente provident assumenda, delectus voluptatum nobis sed dolorem adipisci laudantium incidunt. Error, ratione?
Other formats
Here you can find different accents and emphasis sit amet consectetur adipisicing elit. Obcaecati, iste distinctio veritatis eligendi laboriosam illo nostrum corporis at libero vel voluptas? Expedita, facere dolores voluptatem ad ab rem assumenda soluta!
This is a link and how it could look like bestlinkinthebeautifulworld. Obcaecati, iste distinctio veritatis eligendi laboriosam illo nostrum corporis at libero vel voluptas? Expedita, facere dolores voluptatem ad ab rem assumenda soluta!
Here's just some classic bold text adipisicing elit. Obcaecati, iste distinctio veritatis eligendi laboriosam notBoldSecondbestlinkinthebeautifulworld illo nostrum corporis at libero vel voluptas? Expedita, facere dolores voluptatem ad ab rem assumenda soluta!
Obcaecati, iste distinctio veritatis eligendi laboriosam adipisicing elit illo nostrum corporis at adipisicing elit libero vel voluptas? Expedita, adipisicing facere dolores voluptatem ad ab rem assumenda soluta!
Other cuple of colors in case we want to emphasize several ways adipisicing elit. Obcaecati, iste distinctio veritatis eligendi laboriosam adipisicing elit illo nostrum corporis at voluptatem libero vel voluptas? Expedita, facere dolores voluptatem ad ab rem assumenda soluta!
Adding Images to the content
Lorem ipsum dolor sit amet consectetur adipisicing elit. Obcaecati, iste distinctio veritatis eligendi laboriosam illo nostrum corporis at libero vel voluptas? Expedita, facere dolores voluptatem ad ab rem assumenda soluta! Lorem ipsum dolor, sit amet consectetur adipisicing elit. Quod veniam, quam ad expedita laborum sed at voluptates culpa ipsam ut vel. Ullam temporibus a mollitia quod aliquam ratione exercitationem nesciunt.
Lorem ipsum dolor sit amet consectetur adipisicing elit. Obcaecati, iste distinctio veritatis eligendi laboriosam illo nostrum corporis at libero vel voluptas? Expedita, facere dolores voluptatem ad ab rem assumenda soluta! Lorem ipsum dolor, sit amet consectetur adipisicing elit. Quod veniam, quam ad expedita laborum sed at voluptates culpa ipsam ut vel. Ullam temporibus a mollitia quod aliquam ratione exercitationem nesciunt.
Lorem ipsum dolor sit amet consectetur adipisicing elit. Obcaecati, iste distinctio veritatis eligendi laboriosam illo nostrum corporis at libero vel voluptas? Expedita, facere dolores voluptatem ad ab rem assumenda soluta!
Coding Blocks
Lorem ipsum dolor sit amet consectetur adipisicing elit. Repudiandae quas consequuntur illo numquam assumenda autem exercitationem distinctio perspiciatis in natus. Eius dicta similique ipsam ipsa minima, nemo quae enim tempore.
GPAL
.CallIfNotFound(GenericCallIfNotFound)
.WithPublishToConsole();
//System.Drawing.Rectangle windowSize = new System.Drawing.Rectangle(10, 10, 1500, 1024);
// NOTE: we have to set browser = before we execute any steps
// this is due to the 'GenericCallIfNotFound' which might throw an exception, and BankScraper will not have the browser set when it calls scraper.Close()
// until the complete fluent line gets executed (meaning every step, meaning browser is not set until everything else succeeds)
browser = GPAL.Browser
.WithBrowserType(Enums.BrowserType.Chrome)
.WithProfileDataDirectory(ChromeProfileLocation)
.WithUseAutomationEngine(AutomationEngine.Selenium)
.WithWindowSize(new System.Drawing.Rectangle(0,0,1920,1080))
.ToGPALObject();